UCL Dataviz Workshops 2020
The course structure and some online resources for the UCL Business Management Dataviz module.
Due to the Covid disruption and to accommodate the majority of students in time-zones to the east of the UK, lectures/workshops will run from 10am to 1pm London/UK time. In order to reduce the intensity of a three hour online session, the workshop will be interspersed with mini challenges.
1 (Friday 29 May) 10:00 - 13:00
Introduction to the Module, stating key learning aims, workshop structure and covering any tools that will be used (e.g. Python Jupyter notebooks)
Exploring data using Python notebooks.
Python notebooks have become to the goto environment for much data science and exploratory data visualization work. Here we’ll use one to explore some contemporary Corona Virus and Brexit datasets.
- see Ch. 10 and 11 of “Data Visualization with Python and JavaScript” (DVPJ)
Using Plotly to generate web-friendly charts using Python notebooks
We will take some of the data charts and maps produced and see how easy it is to embed them in a web-page.
2 (Monday 1 June) 10:00 - 1300
Web-dev 101
Here we’ll learn enough web-development skills to be able to embed charts (HTML) (e.g. Plotly, D3, Leaflet), put them where we want them (CSS) and style them (CSS). We’ll also see a little JavaScript in action.
We will also look at Scaleable Vector Graphics (SVG), the markup language used (by D3 and others) to produce many of the iconic modern data visualizations.
- see Ch. 4 “Data Visualization with Python and JavaScript” (DVPJ)
3 (Wednesday 3 June) 10:00 - 1300
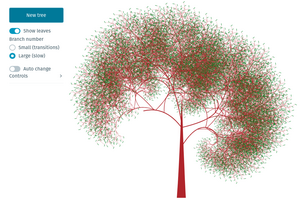
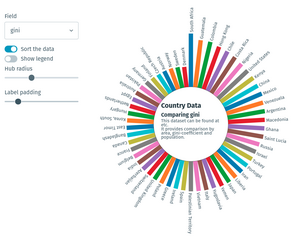
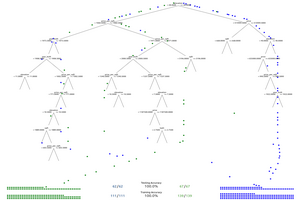
Introducing D3
This workshop will introduce D3, the JavaScript dataviz powerhouse. We will cover basic D3 functionality such as working with selections, adding DOM elements etc. D3 is now a collection of powerful modules that can be used independently - we’ll see a few of the more commonly used ones in action.
- see Ch. 16 DVPJ
4 (Friday 5 June) 10:00 - 1300
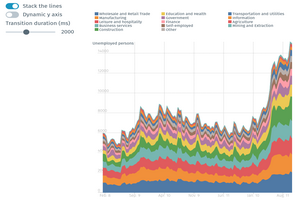
Putting D3 to working
We will see how to use D3 to construct a reasonably ambitious animated chart, based on the famous New York Times Wealth of Nations visualization. Key JavaScript dataviz idioms will be introduced in the process.
5 (Monday 8 June) 10:00 - 1300
An open session. This time will allow students to focus on any of the previous topics, discuss possible thesis visualizations etc. Students are encouraged to send questions and suggestions via email: k.dale@ucl.ac.uk
Course Resources
I’ll be adding to these in the next few weeks (as of early May)
D3 Resources
- D3.org with a huge collection of examples (note the D3 version numbers!)
- D3 Blocks, an enormous collection of editable examples
- Dashing D3, large collection of videos, tutorials etc.
- https://www.d3indepth.com, Pete Cook’s friendlier D3 docs