
Covid Vaccine Efficacy - Visualising Simpson’s Law
I recently came across a tweet which mentioned the likelihood that recent Covid vaccine efficacy stats coming out of Israel were an example of a famous statistical paradox generally attributed to the British statistician Edward Simpson but noticed by a number of predecessors (see the Wikipedia entry for details. Here’s the tweet in question:
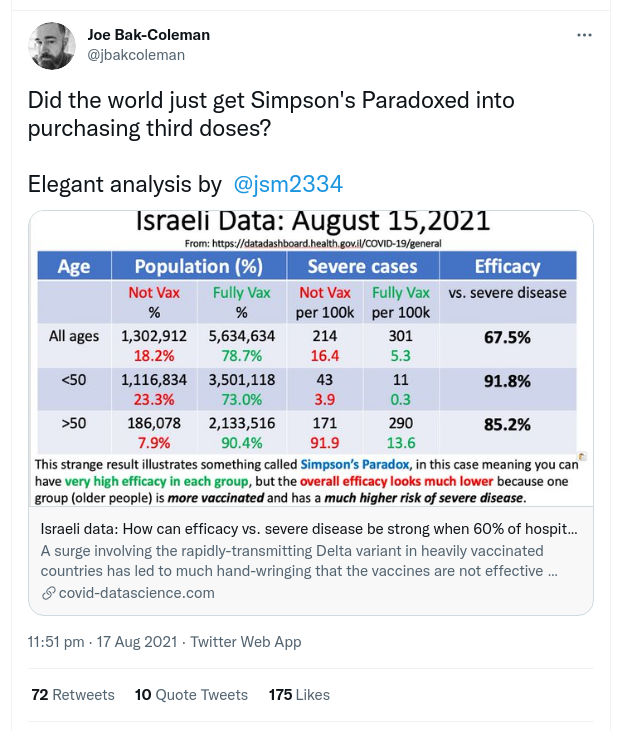
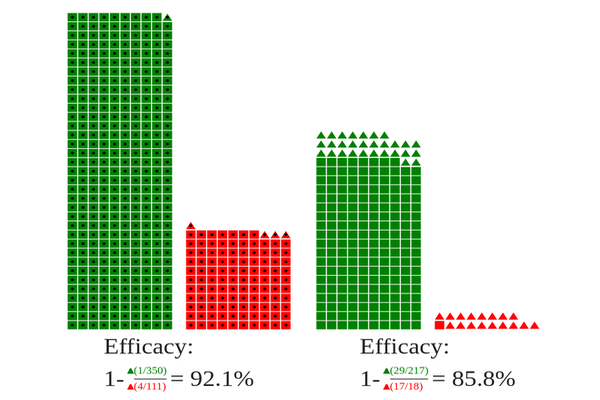
The paradox is that while the efficacy (this term is explained in the linked visualisation) of the vaccine when assessed against the whole population of unvaccinated and fully vaccinated (67.5%) looks low, if we separate the population into over and under 50 years old the efficacy for each of those groups is considerably higher at 91.8% for under 50s and 85.2% for over 50s.
Now this result is pretty counterintuitive for most people but, as the above example shows, failure to grasp it could have serious consequences for health policy . I thought that a little data visualisation might help, showing a smooth transition between a population of all ages and two subpopulations, filtered by age (> and < than 50) and the resulting effect on vaccine efficacy.
Check out the visualisation here