UK Demographics Explorer (Verify GOV.UK) Permalink
A data visualisation for the UK government’’s Verify project, allowing exploration of Verify’’s demographic coverage using a dataset provided by the Office o...
A data visualisation for the UK government’’s Verify project, allowing exploration of Verify’’s demographic coverage using a dataset provided by the Office o...
This visualisation uses a force-directed layout, courtesy of D3, to view approximately 1200 classic Jazz standards by key, date and composer. Some interestin...
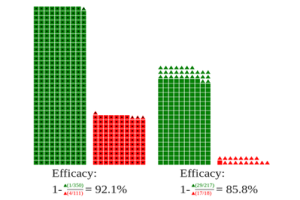
I recently came across a tweet which mentioned the likelihood that recent Covid vaccine efficacy stats coming out of Israel were an example of a famous stati...
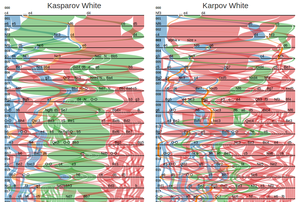
Sometimes it’s good to imagine something a little exotic and then try and realize it using the tools to hand. So here we have a simultaneous chess tournament...
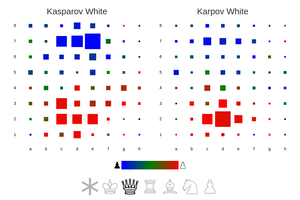
Using the Kasparov-Karpov data-set, this visualisation shows relative occupation times for each square. The occupation times can be filtered by type of piece...
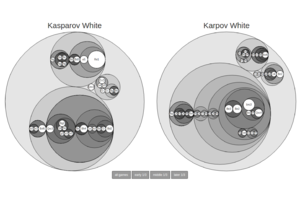
Packed circles are a good way to visualise certain tree structured data. Here I use a dataset of the 135 chess games played by the titans Kasparov and Karpov...
An attempt to capture the multi-dimensional complexity of chess openings, using the dataset of all games played between chess titans Kasparov and Karpov.
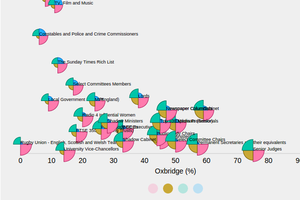
This chart shows the findings of a recent commision into equality in Britain. It found that a small, self-perpetuating elite, attendees of the ‘‘right’’ scho...
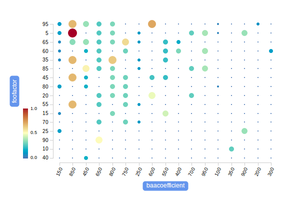
A bespoke D3 histogram, with synchronizing axes. The variable radius and color of the plotted circles allows the representation of four dimensions, the x and...
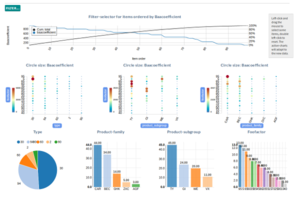
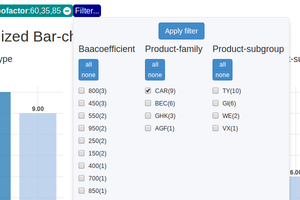
A recent client wanted a way to filter a large dataset of objects while seeing any changes immediately reflected by data-selective charts. Using ...
A recent job required a menu that lets one progressively filter a packet of row-column data, drilling down to items of interest. It was refreshing to use D3 ...
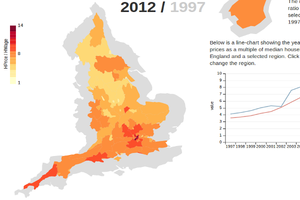
A D3 maps visualization of the change in the ratio of English house-prices to household incomes over the period 1997-2012. By warping the map of England to r...
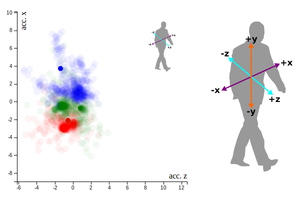
The phone in your pocket isn’‘t just recording your position by satellite and wifi signal (and sending it on to who knows where?), it also has little acceler...
A rainy bank-holiday Monday was a good excuse to try and indulge my aesthetic whims. Something to overload the frontal cortex with colors and symmetries, som...
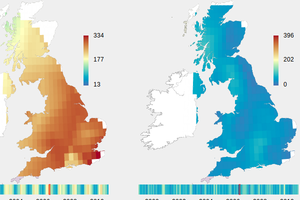
I used Python and D3 to transform some old pages of row-columnar data provided by the UK Meteorological into an animated coloured map, showing hours of...
I decided to try out Observable, Mike Bostock’s (Mr D3) latest venture, by implementing a little demo I did to show how AFrame and D3 can help bring JavaScr...
I needed a chess-viewer for a larger data-viz project I’m working on ( see here ) and D3 seemed like the perfect tool for the job. The viewer takes lists of ...